TrackTik’s security workforce management software is not just helpful to get the processes behind your security operations in order. It is also equipped to help you make informed decisions to improve your bottom-line.
Incident analytics
When your frontline security reports an incident, you and other relevant stakeholders will receive a push notification to assess the risk. But how do you cultivate this real-time data to provide long-term insight? By grouping and analyzing your real-time feed, you can measure trends, identify new areas of concerns and draw comprehensive data-driven conclusions.
TrackTik’s Guarding Suite gives you access to incident analytics at the site and zone level, which you can access under the Security and Patrol heading in the “Analytics” tab. Field data collected in real-time and incident reports filled out by your security guards are filtered into charts for your easy viewing.
So what can you do with incident analytics?
You can view the following preset analytics charts:
- Incident type sorted by month and year
- Site incident count sorted by month and year
- User/reporter of incident(s)
- Incident severity level sorted by month and year
- Incident count by month and year
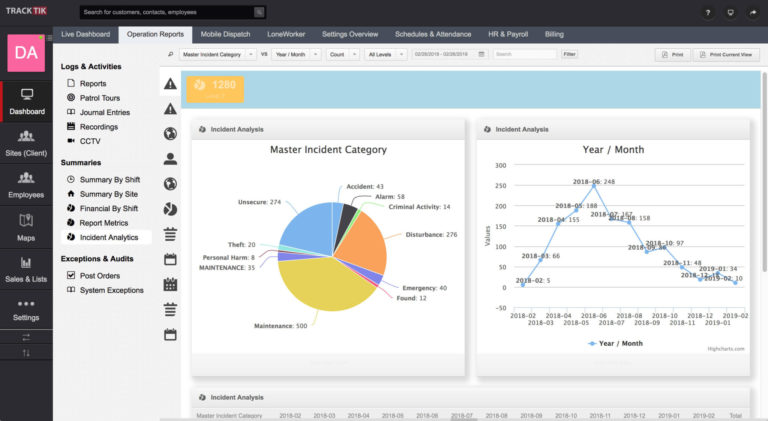
From the preset analytics charts, the incident pie charts provide an overview of the types of incidents reported most often on the property as well the site locations where incidents occur. Another chart, the trend reports show incident trends over time. From the trend reports, you can scroll down to see incident trends organized by days of the week, months of the year and year over year for the site.
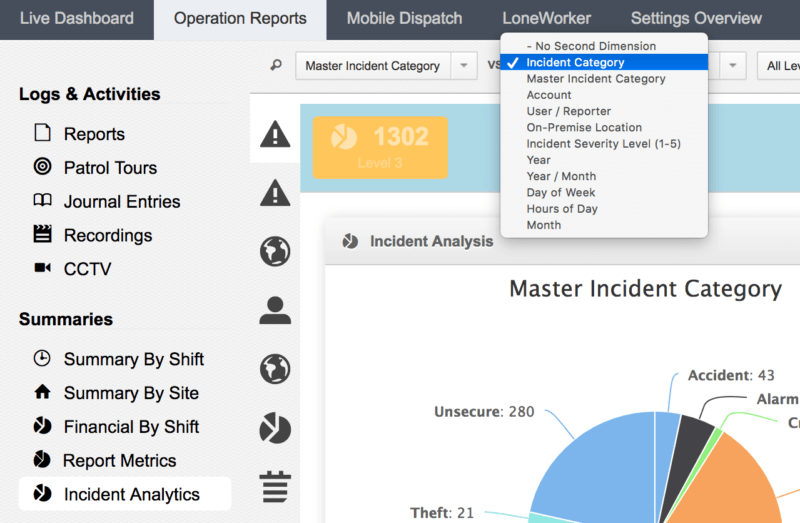
In addition to the preset analytics charts, here’s a how-to guideline to help you customize your incident analytics view in the “Analytics” tab:
- Use the top-left drop-down menu to select the first variable for the charts
- Open the next drop-down to select the second variable
- Choose the method of measurement (typically this is the count of incidents that match the criteria defined above)
- Select which incident priority levels to include
- Apply a date range using one of the preset options or create a custom date range; click on the [Apply] button after selection
- (Optional) Enter keyword(s) to only include incidents that mention the keyword(s)
- Click on the [Filter] button to create the custom analytics view
Print an analytics report:
The reports in incident analytics can be printed out at any time. Click on the [Print] button and the system will generate a printable PDF booklet of the reports in the incident analytics section.
Mobile patrol analytics
In order to make your patrol routes more efficient and to ensure that you provide an effective service, you have to make sure to analyze the facts on the ground. You have to take count of your real-time and historic patrol data so as to be able to track the progression of your daily operations and identify drop-offs and other concerns.
After signing up with TrackTik, data from your run sheets will be neatly organized and manipulated into preset reports that provide operational insight for mobile services. These reports are the patrol analytics.
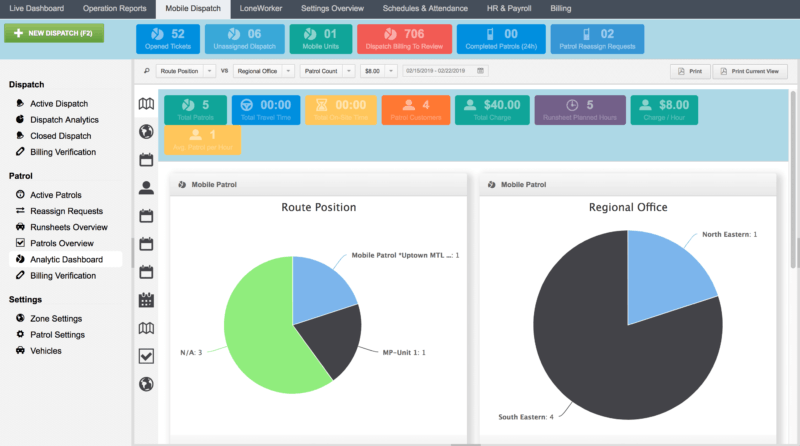
So what can you do with mobile patrol analytics?
You can view the data collected from runsheets and then customize it as well.
Here’s a how-to guideline:
- Select the “Mobile Dispatch” tab from the Live Dashboard
- Select the “Analytics Dashboard” option
- Select one of the icons in the column next to the charts (each icon represents a different report). Hover over the icon to get the title of the report
- (Optional) To customize the reports, use the drop-down menus at the top of the screen to define the variables and parameters for a custom view of the mobile patrol data
Billing analytics
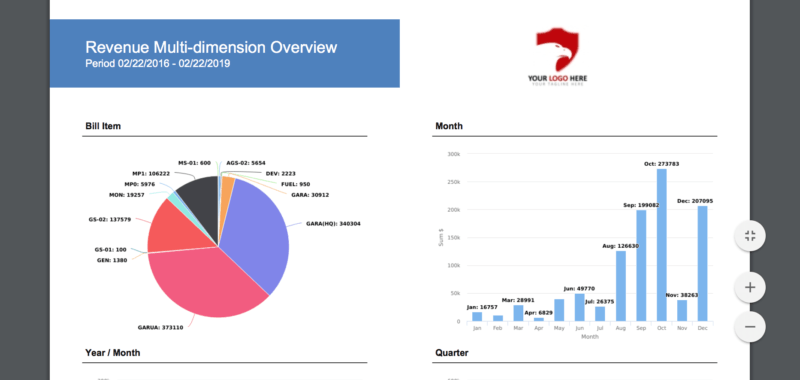
After sending out the right invoices to your clients, you can take it a step further and delve deeper into your profitability analytics through a nifty Billing Analytics compilation. The TrackTik powered billing analytics can create an accurate picture of your revenue pipeline.
So what can you do with billing analytics?
You can access the preset analytics compiled from your sent bills by:
- Clicking on the “Billing” tab from the Live Dashboard
- In the billing menu, select the “Analytics” menu option
- Click on your desired icon to create a preset analytics report. By hovering around the icon, find out how the billing data will be displayed in the report.
The preset billing analytics include:
- Billable items vs. Revenue generated per quarter
- Revenue per client vs. Revenue generated per quarter
- Revenue generated per quarter and/or per month
- Revenue by region
In addition to these preset analytics charts, here’s a how-to guideline to help you customize your billing analytics view in the “Analytics” tab:
- Use the drop-down menu to select the first variable field
- Select the second variable using the drop-down menu on the right
- Choose the method of measurement for the variables, ex. ‘sum’ or ‘count’
- Use the date filter to select the date range. Note that relative date ranges such as Last Month are available and will automatically apply from the current date
Print an analytics report:
The system will automatically create a PDF export of the data in the billing analytics section. To create a PDF export, click on the [Print] button. The PDF export will be created in a new tab, where it can be printed or saved locally.
Paint a better picture with data
The augmentation of data leads to better decisions. In the security space, with access to meaningful information, you can charter your staffing strategy, allocate your resources, showcase value and deliver precision to your stakeholders.
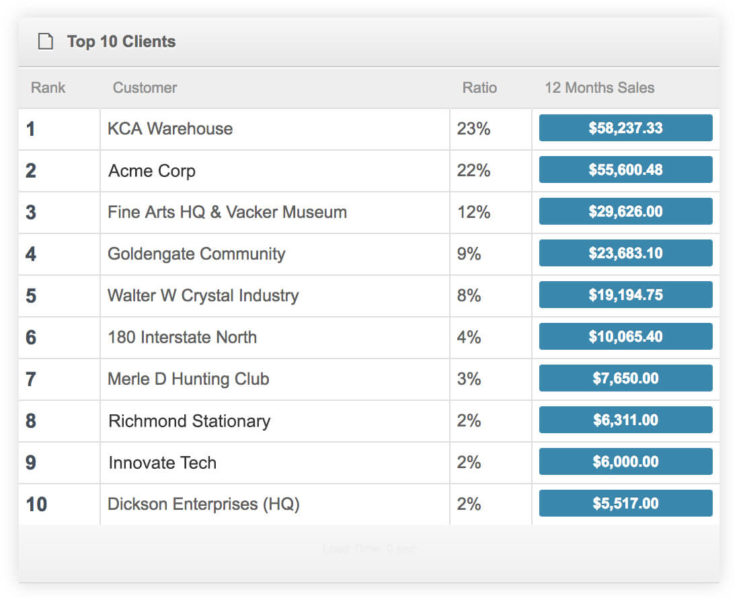
Some other analytics that you can gather from TrackTik include an overview of your top ten customers, your sales per service type, your dispatch analytics, and many more customizable options to fit your needs and priorities. With these numbers in place, you can see where you are the most profitable and how you can increase the value of your security.
